The IDELA team is excited to share a final Data Explorer update before the official launch.
The Data Explorer allows public access to IDELA data through dynamic visuals, empowering individuals, teams and organizations to make better data-driven decisions in early childhood development.
To see the Data Explorer as it developed, visit the First and Second previews.
If you want to be one of the first to test out the Data Explorer join us for the official launch, August 18th.
Register for the launch webinar here.

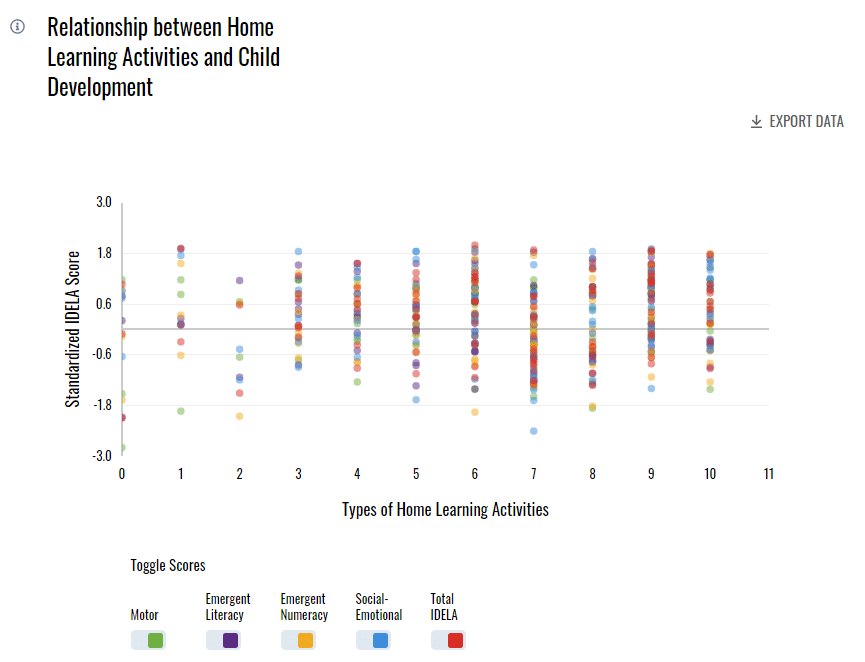
The Home Learning Activities graph above shows the relationship between children’s IDELA score and the number of home learning activities parents reported doing with their child.
- Did an increased number of home learning activities significantly impact children’s IDELA score?
- Was there a stronger correlation between activities and children’s scores in certain domains?
This graph, with the detail provided in the Data Explorer, can help answer these questions.
In the view above, all domains of IDELA and IDELA total score are plotted, giving you a colorful view of the data.
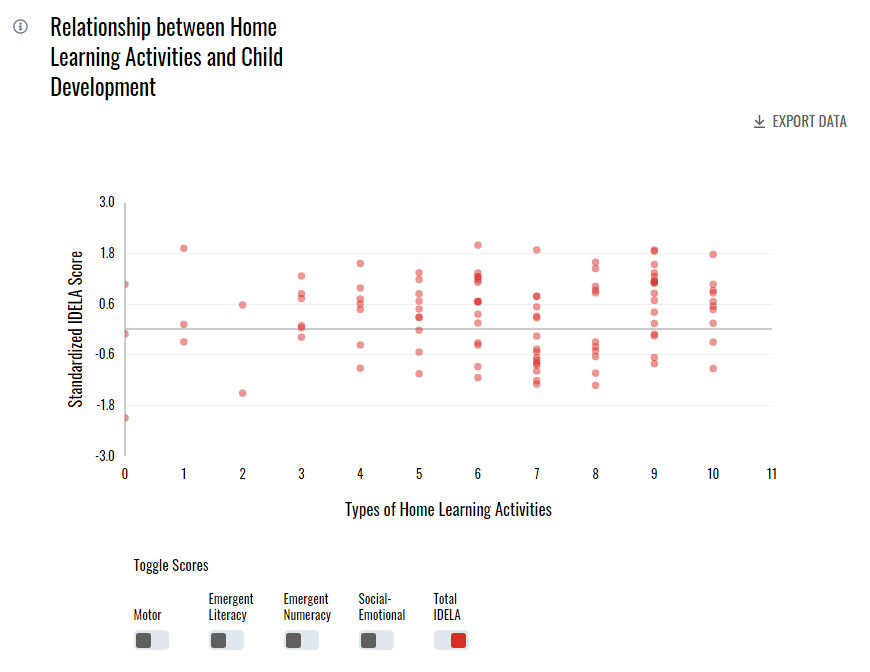
Users can customize the graph by turning on specific domains, or filtering for age, gender or location. Below, you can see an example of the same graph, looking specifically at the correlation between home learning activities and children’s scores in motor skills.

To tour the new Data Explorer and dive into visualizations for yourself, join Save the Children and global partners for the Data Explorer launch, August 18th. Register here.